To compute a simple moving average (SMA), sum the closing prices over a certain number of periods and divide by this number. A 10-day SMA, for instance, sums the last 10 closing prices and divides by 10.
Toruscope » Online Trading » Mastering Moving Averages in Stock Trading
One of the most widely used stock trading technical analyses tool is the moving average indicator. Both experienced and inexperienced traders use it to determine market trends and spot buy and sell signals. This blog seeks to give readers a deeper insight into the moving average indicator, types of rolling averages, why it matters, and how it fits into other trading techniques.
Various Types of Moving Averages
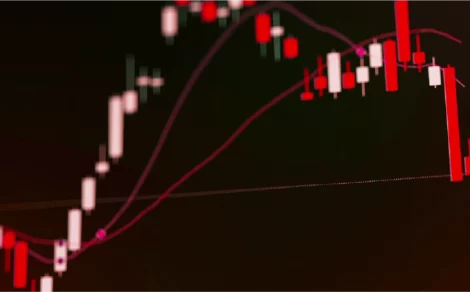
Before diving into complex strategies, it is important to answer a fundamental question: what is moving average (MA)? Simply put, a moving average is a statistical calculation used to analyze data points by creating a series of averages of different subsets of the complete dataset. In trading, it smoothens out price data to create a single flowing line, making it easier to identify the direction of the trend.
There are a variety of moving average indicators, which suit various types of trading techniques and objectives:
- Simple Moving Average (SMA): A plain average of the prices over some time.
Formula: sum of closing prices / number of periods
- Exponential Moving Average (EMA): Places greater weight on recent prices, so it is more sensitive to new data.
- Weighted Moving Average (WMA): Gives different weights to each observation, giving greatest weight to newer observations.
- Smoothened Moving Average (SMMA): A longer form of EMA, providing a smoother line.
- Hull Moving Average (HMA): An advanced moving average that cuts down on lag quite a bit and adds smoothness. It does this by utilizing the Weighted Moving Average repeatedly in its computation. This renders the HMA very valuable to swing traders and others who require indicators that respond quickly to changes in price without the choppiness usually seen in standard averages.
- Adaptive Moving Average (AMA): AMA or Kaufman’s Adaptive Moving Average (KAMA), adjusts its sensitivity according to market conditions, by varying the smoothing constant in response to volatility and noise. Because of this ability to adapt, it can remain stable during sideways or ranging markets, yet increase responsiveness during trending markets. As a result of this dual ability, the AMA is particularly well-suited for volatile markets, enabling traders to make more informed decisions.
Optimum Moving Average for Trading
Selecting best moving average for trading purposes will depend on your targets and time period for investment. Short traders would use the 9-day or 20-day EMA in order to grab fast signals, whereas long-term investors might trust in the 50-day or 200-day SMA to view long-term trends. The moving average indicator may be customized depending on any sort of trading mode for which you might be.
What’s the Importance of Moving Average Method in Trading?
The Moving Average method is a key tool in trading and financial analysis, helping investors cut through market noise by smoothing out price fluctuations. This makes it easier to identify overall trends and momentum in a stock or index. One of its most powerful uses is in generating buy and sell signals—especially through moving average crossovers. For example, when a short-term average crosses above a long-term one, it often signals a bullish trend. Moving averages, whether simple or exponential, also help spot support, resistance, and potential reversals. Overall, they provide a clearer, data-driven foundation for smart trading decisions.
Combining MA with other indicators
While moving average is a powerful, they work best when used with other technical indicators.
- RSI (Relative Strength Index): Helps confirm whether a stock is overbought or oversold.
- MACD (Moving Average Convergence Divergence): Combines MA to identify changes in trend strength.
- Volume: Confirms the strength of a trend when used alongside MA crossovers.
Using a combination reduces false signals and strengthens decision-making.
Benefits and Drawbacks of Moving Average
| Benefits of Moving Averages | Drawbacks of Moving Averages |
| Helps identify market trends | Lags behind real-time prices |
| Smoothens out price data | May give false signals in a choppy market |
| Easy to use and interpret | Ineffective during sideways or ranging markets |
| Works well with other technical indicators | Requires fine-tuning to match market conditions |
Conclusion
In short, the moving average indicator needs to be understood by whoever is interested in technical analysis. It’s no crystal ball, but it provides useful insights into what direction the market is headed and where one might enter or exit. By using the moving average indicator alongside other tools, traders are able to develop a more complete trading strategy. Like with all tools, it’s essential to understand both the pros and cosn of moving averages to effectively apply them.
Ready to invest in stock market? Open your free Demat account with Torus Digital now!
Frequently Asked Questions
The basic use of the moving average indicator is to reduce short-term price volatility and accentuate the long-term trend.
Moving average is interpreted by the traders for trend confirmations, crossovers, and interactions with price. Multiple MAs are commonly employed to recognize momentum and reversals.
Moving average indicator is commonly paired with RSI, MACD, and Bollinger Bands for trend confirmations or reversal signals. Use of multiple indicators makes trading decisions more accurate.
Moving averages in trading are trend-following indicators that average previous prices to determine the direction of a market. They are computed by various formulas based on the type—SMA, EMA, WMA, etc.
The standard technique is implementing crossover techniques. For instance, when the short-term moving average indicator moves up above the long-term one, it tends to be used as a signal for buying. Contrarily, crossover could provide the signal for selling.
There isn’t a one-size-fits-all solution. Short-term traders use EMAs for immediate responses, while long-term traders may use SMAs for a stable trend perception. The ideal moving average for trading is determined by your strategy and objectives.
Related Reads
What is Slippage in Trading? Meaning, Causes & Impact Explained
In trading, timing and precision often define success. However, even when a trader believes...
By: torus
- 7 mins
- 01.Jul.2025
- 4(1)
- 96
What is an Option Contract?
Imagine having the flexibility to buy or sell shares at a fixed price, no...
By: torus
- 7 mins
- 01.Jul.2025
- 0(0)
- 43
Types of Financial Instruments You Should Know Before Investing
Before investing funds in any market, it is essential to understand what financial instruments...
By: torus
- 7 mins
- 01.Jul.2025
- 0(0)
- 39
What are Contracts for Difference (CFD)?
Contracts for Difference, commonly known as CFDs, are financial instruments that allow traders to...
By: torus
- 9 mins
- 01.Jul.2025
- 0(0)
- 38
Difference between Short Position & Long Position
Understanding the concepts of short and long positions is essential for anyone interested in...
By: torus
- 8 mins
- 01.Jul.2025
- 0(0)
- 38
Essential Trading Terminologies You Need to Know
Trading in financial markets opens a world full of opportunities. For many first-time investors,...
By: torus
- 8 mins
- 01.Jul.2025
- 0(0)
- 47
Disclaimer: The content provided in this blog is for informational purposes only and does not constitute financial advice or recommendations. The content may be subject to change and revision. Readers are encouraged to conduct their own research and consult with a qualified financial advisor before making any investment decisions. Torus Digital and its affiliates takes no guarantees whatsoever as to its completeness, correctness or accuracy since these details may be acquired from third party and we will not be responsible for any direct or indirect losses or liabilities incurred from actions taken based on the information provided herein. For more details, please visit www.torusdigital.com.
Tenneco Clean Air IPO Listing: Strong Market Debut with 27% Premium
Tenneco Clean Air India Ltd made a confident entrance into the public markets on...
By: torus
- 5 mins
- 19.Nov.2025
-
3.7(6)
-
377
Stock to Buy Today: November 19, 2025
The Indian stock market witnessed a mild decline on November 18, 2025, ending a...
By: torus
- 4 mins
- 19.Nov.2025
-
4.3(3)
-
377
Mirae Asset Infrastructure Fund NFO: A Sector-Focused Bet on India’s Growth
Mirae Asset Mutual Fund has launched a new equity scheme — Mirae Asset Infrastructure...
By: torus
- 4 mins
- 18.Nov.2025
-
4.3(6)
-
377
Emmvee Photovoltaic IPO: Shares Make Muted Market Debut, List Flat At ₹217
Emmvee Photovoltaic Power made a muted debut on 18 November 2025, listing flat at...
By: torus
- 3 mins
- 18.Nov.2025
-
3.7(6)
-
377


