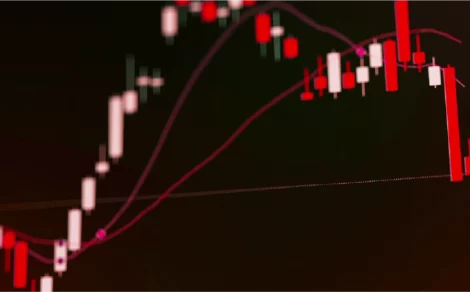
Trading strategies can be overwhelming in real market conditions. Market indicators often contradict each other and have no practical use in such situations. Mastering a price action trading strategy in 2025 can be the answer to this problem. This strategy depends on historical price movements and not on technical indicators or algorithms. This blog will help you understand the fundamentals of price action trading and how to do trading without indicators.
What is Price Action Trading?
Price action trading is an approach to analyse financial markets based solely on historical price movements. This strategy uses candlestick patterns, trend lines, support and resistance levels, etc., to predict future price movements. Traders believe all necessary information for future price prediction is already embedded in the price data, and there is no need to rely on indicators like moving averages or RSI.
Benefits of Price Action Trading Strategy 2025
Price Action Trading is used by many traders when they find indicators to be lagging and misleading. The reasons why trading without indicators can be more effective are:
- Clarity & Simplicity: It is easy to identify market trends with clean and simple charts.
- Real-Time Assessment: Unlike indicators, price action trading uses real-time decision-making.
- Adaptability: The price action trading strategy is adaptable across all timeframes and market conditions.
- Risk Management: By focusing on price structure rather than external indicators, traders can set better decisions in terms of stop-loss and profit levels.
Understanding Market Psychology
It is necessary to understand the market psychology to implement a successful price action trading strategy. Emotions such as fear, greed, and excitement often drive market price movements. This human element provides valuable insights into potential reversals or continuations.
- Fear and Greed Cycles: The market drops when fear dominates, and prices increase rapidly where greed is prevalent. These emotional responses create repetitive price patterns.
- Market Sentiment: Tracking traders’ general moods can provide important clues about the direction of the market.
- Order Flow: Identifying the buying and selling trends of large institutional players helps traders stay on the right side of the trend.
Key Concepts of Price Action Trading
It is important to understand the essentials of price action trading to develop a successful strategy.
-
Market Structure
Market structure refers to the overall trend and direction of price movements. Traders need to analyse the market’s pattern to identify high-probability trading opportunities.
- Recognising Uptrends or Downtrends: Understanding how these formations signify higher highs or lower lows.
- Identifying Trend Lines and Breakouts: Using trendlines to define channels and ranges of support and resistance levels. Breakouts from these lines often signal where prices typically move.
- Momentum and Phases: Weakening of momentum signals potential reversals.
- Volume Analysis: Market strength can be confirmed by understanding the relationship between price and volume.
-
Support and Resistance Levels
Price reacts at the support and resistance levels. By effectively identifying these zones, traders can predict potential entry or exit points in the market.
- Horizontal Support and Resistance: The market tends to reverse or stall at these levels.
- Dynamic Support/Resistance: Moving averages can act as dynamic support or resistance at these levels.
- Psychological Levels: Round numbers often act as significant support or resistance, such as 1.3000 in forex.
- Supply and Demand Zones: Buying or selling pressure is expected to emerge at these levels.
-
Candlestick Patterns
Candlestick patterns are at the heart of price action analysis. They provide insights into market sentiments and clues about market reversals or continuations.
- Reversal Patterns: The formation of patterns like pin bars, engulfing bars, and hammers indicates turning points.
- Continuation Patterns: Traders stay in trades when they spot inside bars and other multi-bar patterns.
- Multiple Candlestick Formations: A series of candles can perceive more reliable signals than a single candle.
- Japanese Candlestick Techniques: Traditional Japanese methods like Doji, Marubozu, and Harami are also used to determine sentiments and predict market movement.
Best Day Trading Techniques Using Price Action
Below are some of the trading techniques used in price action trading strategy:
-
The Break and Retest Strategy
This strategy involves identifying key levels of support or resistance trading breakouts and the retest done at the broken level before making a move. As a highly effective price action trading strategy in 2025, this technique involves:
- Identifying key support or resistance levels
- Waiting for a break level
- Performing a retest and confirming the direction
- Entering the trade
-
The Momentum Trading Strategy
It is based on the principle that an asset’s momentum indicates its acceleration in price. A stock rising faster than usual indicates a positive momentum, while a stock falling more rapidly than normal suggests a negative momentum. The method involves:
- Identifying strong bullish or bearish candles
- Entering trades in the direction of momentum
- Using trailing stop-losses to maximise profits
-
The Reversal Trading Strategy
In this strategy, profit is earned by taking an opposite position to the current market trend. Reversal trades aim to catch trend changes that involve:
- Identifying overextended price moves
- Looking for reversal candlestick patterns (Pin Bar, Engulfing, etc.)
- Confirming reversal using volume or divergence
Understanding Stock Market Patterns in Price Action Trading
Recognising stock market patterns increases accuracy in predicting price movements. Key patterns include:
-
Double Top and Double Bottom
Double top and bottom patterns signal key market reversals, with a double top suggesting bearish trends and a double bottom indicating bullish trends.
-
Head and Shoulders Pattern
This bearish reversal pattern forms at the peak of an uptrend, signaling that the trend is about to reverse.
-
Flags and Pennants
These patterns indicate a continuation of an upward or downward trend after consolidation.
Risk Management in Price Action Trading
The below risk management steps can be taken to protect your capital:
- Set Stop-Loss Orders: Always consider stop-loss orders before entering a trade.
- Position Sizing: Not more than 1-2% of your capital should be utilised on a single trade.
- Diversification: Diversify across asset classes to minimise risk.
- Maintain a Trading Journal. Tracking trades over time will provide key insights into where your trading practices can be improved.
Conclusion
The price action trading strategy in 2025 is one of the best day trading techniques for taking your skills to the next level. However, it requires discipline, patience, and practice. Unlock consistent and profitable stock market investments with Torus Digital Share Market App — start your journey today!


